
TL;DR
A developer has launched a Show HN project that visualizes London train movements in 3D using deck.gl and live data from TFL and National Rail. The tool enables real-time tracking of trains across London and to nearby airports, with minimal drift. The project is in early stages but offers a promising new way to monitor transit.
A developer has introduced a Show HN project that visualizes London train movements in 3D using the deck.gl library. The visualization pulls data from the Transport for London (TFL) API and National Rail, enabling users to track trains across London and to airports in near real-time. This development offers a new perspective on transit data, combining live updates with an interactive 3D map.
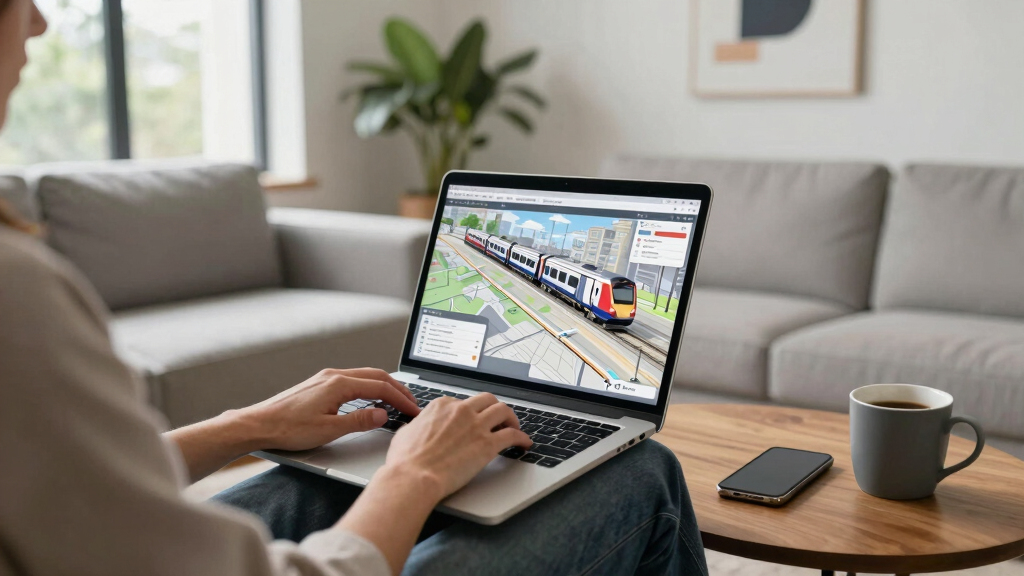
The project uses deck.gl, a powerful WebGL-powered visualization library, to render a dynamic 3D map of train locations. Users can select individual trains from any platform in London, with the system displaying their current position and trajectory. The visualizer aims to minimize drift, providing a close approximation of real-time movements based on live API data. The developer notes that the tool is still in early stages but demonstrates the potential for more immersive transit monitoring.
The visualization integrates data from the TFL API for London Underground and Overground services, as well as National Rail data for overground trains heading to airports and beyond. The project is accessible via a web interface, allowing users to explore train routes and statuses interactively. The developer has shared the project on Show HN, inviting feedback and contributions for further refinement.
Potential Impact of 3D Train Tracking in London
This project highlights the possibilities for more accessible and engaging transit data visualization. By presenting real-time train movements in a 3D environment, it could enhance public awareness of transit conditions and improve planning for travelers. Additionally, the approach could inspire further development of interactive transit tools, potentially integrating with apps or station displays. While still in early development, such visualizations could contribute to smarter urban mobility solutions and increased transparency in public transportation systems.

Next London Tube Tracker
- Live Train Timetable: Real-time train schedule updates
- Network Status Info: Current service status updates
- London Underground Map: Interactive tube map
As an affiliate, we earn on qualifying purchases.
As an affiliate, we earn on qualifying purchases.
Background on Transit Data Visualization Efforts in London
London has long been a leader in transit data transparency, with the TFL API providing real-time information about tube, bus, and rail services. Prior efforts have focused on 2D maps and static data dashboards. The recent emergence of WebGL and libraries like deck.gl has enabled more immersive visualizations. This project builds on those technological advances by offering a 3D perspective, which is less common in public transit apps. The developer’s initiative follows a broader trend of open-source transit tools designed to increase user engagement and data accessibility.
“Using deck.gl allows us to visualize train movements in a way that’s both informative and visually engaging. It’s still early days, but the potential is huge.”
— Developer behind the project
Limitations and Unconfirmed Aspects of the Visualization
It is not yet clear how accurately the visualization minimizes drift or handles data latency. The developer notes that the system is still in early development, and live data accuracy may vary. Additionally, the full extent of features—such as historical tracking or integration with other transit modes—is still under consideration. The stability and scalability of the visualization for broader public use remain unconfirmed.
Next Steps for Development and Public Access
The developer plans to refine the visualization, improve data handling, and add features like route overlays and historical playback. They are also seeking feedback from the community via Show HN to guide further development. Future updates may include mobile compatibility, expanded data sources, and integration with transit apps. The project’s creator aims to open it for broader public testing in the coming months.
Key Questions
How accurate is the train tracking in this visualization?
The system currently relies on live data from TFL and National Rail APIs, but some drift or latency may occur due to data refresh rates and processing delays. It is an early prototype, so accuracy is approximate.
Can I use this visualization to plan my journey?
Not yet. The project is primarily a visualization tool for demonstration and development purposes. It is not integrated into official journey planning services.
Will this be available to the public?
The developer is considering public release after further testing and feature development. Feedback from users will likely shape future versions.
Does this include data for buses or only trains?
Currently, the visualization focuses on train movements from TFL and National Rail data. Buses are not included at this stage.
Source: hn